Results from previous local government elections in the City of North Vancouver are provided below.
Historic Voter Turnout
View the number and percentage of eligible voters by year by clicking below.
Voter Turnout by Year
The percentage of registered voters who cast a ballot in a local election is shown in the table below.
| Election Year |
Number Registered Voters
|
Voter Turnout |
| 2022 |
41,325 |
22.64% |
| 2018 |
38,163 |
34.0% |
| 2014 |
34,127 |
30.0% |
| 2011 |
33,415 |
21.2% |
| 2008 |
31,352 |
17.67% |
| 2005 |
30,327 |
22.37% |
| 2002 |
24,983 |
26.13% |
| 1999 |
23,193 |
25.99% |
| 1996 |
|
18.79% |
| 1993 |
|
18.89% |
| 1990 |
|
21.69% |
| 1987 |
|
13.33% |
| 1985 |
|
18.06% |
| 1983 |
|
13.50% |
| 1981 |
|
23.00% |
| 1979 |
|
15.42% |
| 1978 |
|
7.96% |
| 1977 |
|
21.80% |
| 1976 |
|
14.97% |
| 1975 |
|
22.90% |
| 1974 |
|
13.43% |
Previous Election Results
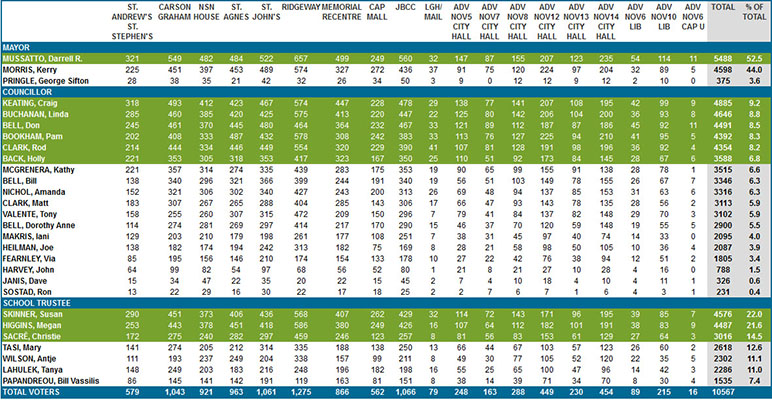
Results for the past four local government elections are available on the Civic Info BC website. Detailed results for each election since 2002 are included below.
2022 Results
Total Registered Voters: 41,325
Voter Turnout: 22.64%

Successful candidates are identified in green.
The above is a true statement of the number of votes at the close of the election on October 15, 2022 given under my hand at the City of North Vancouver this 19th day of October 2022.
Nikolina Vracar, Chief Election Officer
2018 Results
Total Eligible Voters: 38,163
Voter Turnout: 34.0 %

Successful candidates are identified in blue.
The above is a true statement of the number of votes at the close of the election on October 20th, 2018 given under my hand at the City of North Vancouver this 24th day of October, 2018.
Karla Graham, Chief Election Officer
2014 Results
Total Eligible Voters: 34,127
Voter Turnout: 30.0 %

Successful candidates are identified in green.
The above is a true statement of the number of votes at the close of the election on November 15th, 2014 given under my hand at the City of North Vancouver this 19th day of November, 2014.
Karla Graham, Chief Election Officer
2011 Results
Total Eligible Voters: 33,415
Voter Turnout: 21.2 %
Successful candidates are identified in blue.
*Pursuant to section 140(1) of the Local Government Act, at the conclusion of a judicial recount conducted by the Provincial Court of British Columbia, the results for these candidates was declared by The Honourable Judge J. Auxier on November 29, 2011, with Christie Sacre being declared a successful candidate for school trustee.
The above is a true statement of the number of votes at the close of the election on November 19, 2011 given under my hand at the City of North Vancouver this 22nd day of November, 2011.
Robyn Anderson, Chief Election Officer
2008 Results
Total Eligible Voters: 31,352
Voter Turnout: 17.67%
Darrell R. MUSSATTO is hereby declared to be elected by acclamation as Mayor.
Successful candidates are identified in blue.
The above is a true statement of the number of votes at the close of the election on November 15, 2008 given under my hand at the City of North Vancouver this 19th day of November, 2008.
Sandra E. Dowey, Chief Election Officer
2005 Results
Total Eligible Voters: 30,327
Voter Turnout: 22.37 %
2002 Results
Total Eligible Voters: 24,983
Voter Turnout: 26.13 %
The above is a true statement of the number of votes at the close of the election on November 16, 2002 given under my hand at the City of North Vancouver this 18th day of November, 2002.
"Original Signed by B.Hawkshaw"
Bruce Hawkshaw
Chief Election Officer